Gov. J.B. Pritzker announced Tuesday, Jan. 31, that the state’s public health emergency will end on May 11, aligning the state with the federal government’s decision to end the national public health emergency. “Our state’s disaster proclamation and executive orders enabled us to use every resource at our disposal from[Read More…]
Tag: COVID-19
U of I institute, state health department launch COVID-19 tracker
The Discovery Partners Institute (DPI) and the Illinois Department of Public Health (IDPH) announced on Tuesday, Jan. 10, a new website that tracks the levels of COVID-19 in wastewater samples in Chicago and other cities across Illinois. The reporting site closest to Homewood and Flossmoor is the Calumet Water Reclamation Plant in Riverdale. The[Read More…]
State reports 54 counties are at an elevated level for COVID-19
The Illinois Department of Public Health (IDPH) announced on Friday, Dec. 30, the CDC is reporting 54 counties in the state are at an elevated level for COVID-19. Of those, five Illinois counties are at a high level, compared to 33 a week ago; while 49 counties are at medium[Read More…]
Health officials: 1.5M in state have received bivalent COVID-19 vaccines
The Illinois Department of Public Health (IDPH) reported on Thursday, Nov. 10, that more than 1.5 million people in Illinois have received a dose of the new bivalent COVID-19 vaccines since they were authorized for use in September, with about 160,000 doses administered in the last week. The state also[Read More…]
Governor eases COVID-19 restrictions for school, child care staff
Illinois Gov. J.B. Pritzker on Thursday, Sept. 15, rescinded requirements that unvaccinated school and childcare personnel get tested for COVID-19 twice weekly. The change goes into effect Friday, Sept. 16. Pritzker said the decision was made on the advice of medical experts, based on the current conditions of the COVID-19[Read More…]
Park district drops COVID-19 vaccination requirement for staff
The Homewood-Flossmoor Park District decided to drop its COVID-19 vaccination requirement for staff. During a Board of Commissioners meeting Tuesday, Sept. 6, the board voted unanimously to drop the requirement that the board put in place a year ago. The board was cautiously reopening its facilities in 2021 and decided,[Read More…]
Changeover from COVID-19 individual contact tracing calls to automated case notification begins June 1
The Illinois Department of Public Health (IDPH) today announced it is shifting its COVID-19 contact tracing efforts and individual case investigation telephone calls to focus on a more strategic approach of automated case notifications. Starting June 1, 2022, IDPH no longer will make individual case investigation calls to persons positive[Read More…]

Health & Wellness 2022: Back to the Doctor
Editor’s note: This story is the third in a series originally published in the Chronicle’s April 1 print edition, part of the annual Health & Wellness supplement sponsored by Franciscan Health. We’ve probably all heard the old adage: “An apple a day keeps the doctor away.” But, even if you[Read More…]
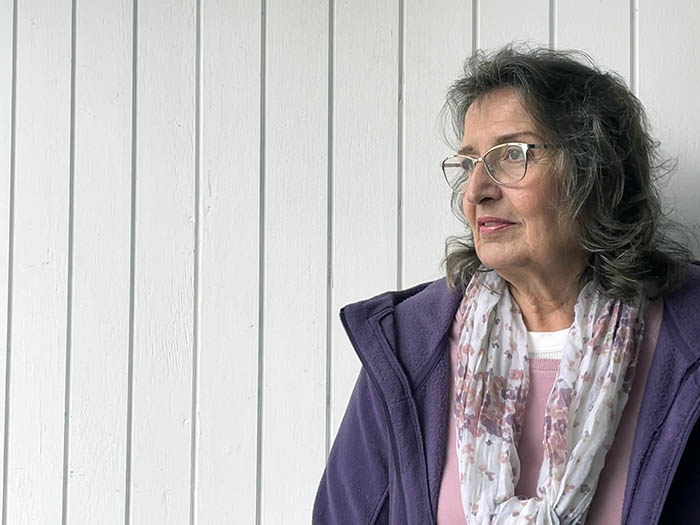
Health & Wellness 2022: ‘My heart was broken by COVID’
As she continued working as an MRI technologist during the COVID-19 pandemic, Rose Wiley said the job became lonely and politically fraught, with patients refusing to wear masks and even spitting at her. (Carole Sharwarko/H-F Chronicle)
State to close COVID-19 testing, vaccination sites March 31
In response to what it said is a sharp drop in demand, the Illinois Department of Public Health (IDPH) announced on Friday, March 25, that it will discontinue COVID-19 testing services at the 10 community-based testing sites, including the one at South Suburban College in South Holland, effective March 31.[Read More…]