
The Illinois Department of Public Health (IDPH) today announced it is shifting its COVID-19 contact tracing efforts and individual case investigation telephone calls to focus on a more strategic approach of automated case notifications. Starting June 1, 2022, IDPH no longer will make individual case investigation calls to persons positive[Read More…]
Tag: pandemic
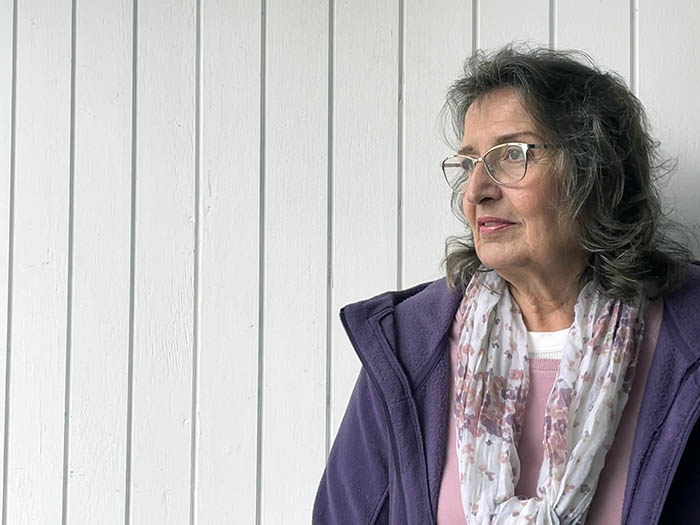
Health & Wellness 2022: ‘My heart was broken by COVID’
As she continued working as an MRI technologist during the COVID-19 pandemic, Rose Wiley said the job became lonely and politically fraught, with patients refusing to wear masks and even spitting at her. (Carole Sharwarko/H-F Chronicle)
State to close COVID-19 testing, vaccination sites March 31
In response to what it said is a sharp drop in demand, the Illinois Department of Public Health (IDPH) announced on Friday, March 25, that it will discontinue COVID-19 testing services at the 10 community-based testing sites, including the one at South Suburban College in South Holland, effective March 31.[Read More…]
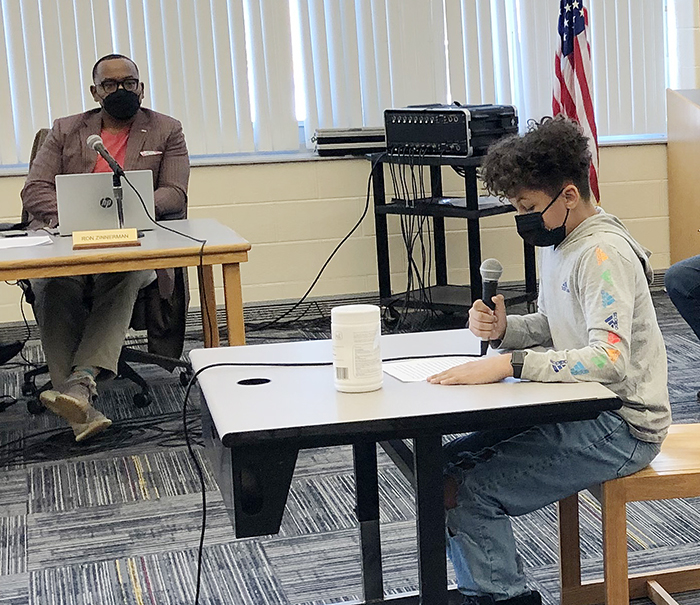
District 153 continues its mask mandate
Gabriel Cohn, a fifth grader at Churchill School, urged the District 153 school board to continue its mask mandate. (Marilyn Thomas/H-F Chronicle) The District 153 school board voted at a special board meeting Sunday, Feb. 6, to continue its mask mandate and other COVID-19 protocols for students, staff and visitors[Read More…]
District 153 hold special meeting on COVID-19 mask, vaccine mandates
The District 153 school board will meet in special session at 2:30 p.m. Sunday, Feb. 6, to discuss the Sangamon County judge’s decision to drop mandated vaccines and mask-wearing in schools. The meeting is open to the public. The session will be conducted at the Dale Mitchell Administrative center conference[Read More…]
IDPH marks 2-year anniversary of COVID-19 in state
The Illinois Department of Public Health announced on Monday the second anniversary of the first COVID-19 case reported in the state. Two years later, IDPH is reporting more than 30,000 COVID-19 deaths during the pandemic. “On Jan. 24, 2020, when we announced the first case of COVID-19 in Illinois, we[Read More…]

During COVID shutdown, H-F devised plans to help struggling students complete credits
When schools across Illinois shut down because of COVID-19, some students at Homewood-Flossmoor High School had a difficult time learning from home and staying on track with coursework. The number of incomplete courses or failures had faculty and staff devise creative approaches to help dozens of students catch up with[Read More…]
Cook County exceeds 14,000 COVID-19 deaths
Just over two weeks after confirming 13,000 COVID-19 deaths in Cook County, the Medical Examiner’s Office (MEO) marked another grim pandemic milestone on Friday, confirming the County’s 14,000th death due to COVID-19 infection. The Office noted that six weeks passed between the county’s 12,000th and 13,000th COVID-19 deaths and more[Read More…]
UChicago Medicine-Ingalls plans to reopen urgent aid services on Tuesday (free)
UChicago Medicine at Ingalls – Flossmoor will reopen its 24-hour urgent aid location at 7 a.m. on Tuesday, Jan. 18. While the rest of the clinic remained open, urgent aid services temporarily closed on Dec. 29, 2021, as surging COVID-19 cases created what UChicago officials called “unprecedented demand across our[Read More…]
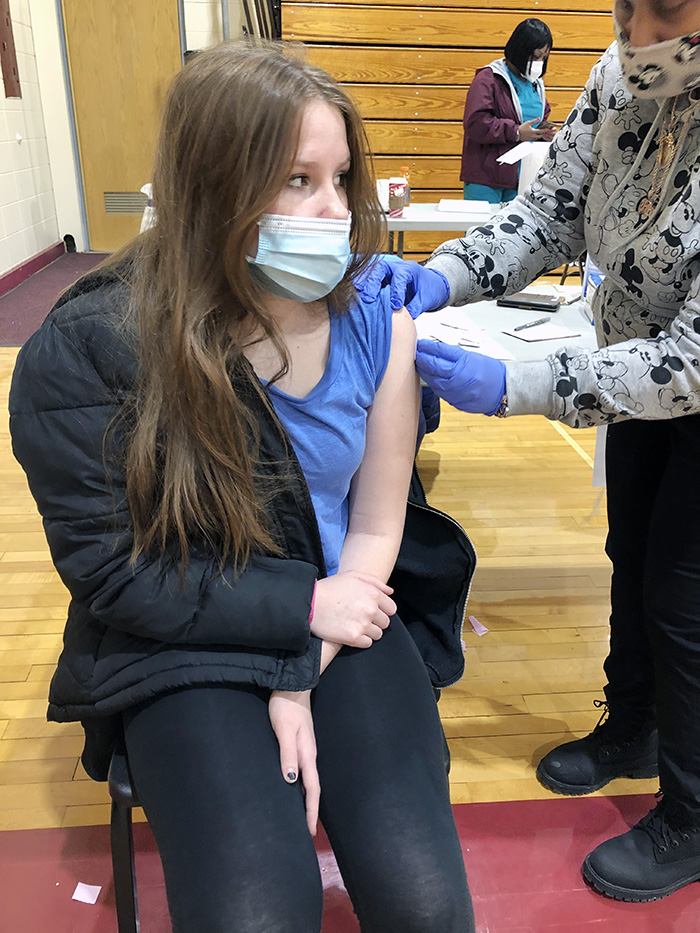
Vaccine site at James Hart School draws a crowd
The Illinois Department of Public Health’s vaccine event Friday, Jan. 7, at James Hart School drew dozens of people for first, second and booster shots against COVID-19. The first such event at James Hart was held in December. People were in line by 2:30 p.m. for the three-hour event in[Read More…]